-
Subject:
Math
-
Topics:
math, graphing, charts, histograms
-
Materials:
Post-it® Notes, markers & dry erase markers
-
Grade Level:
1st - 8th Grade, ESL
-
Author:
tina91
-

-

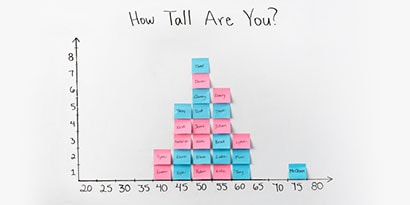
Have students collect data that can be continuous such as height. Record their height in inches on a Post-it® Note.
-

Draw and label an X- and Y-axis on the board with categories of classification that are as wide as a Post-it® Note.


- Ask your students to place their Post-it® Note in the correct category, stacking them as they go.
- Immediately everyone will see the shape of the histogram. Your students will enjoy using personal data and a chance to move around.
-

To discuss the effects of class width, you can recreate the histogram with smaller or larger class widths. As you complete the exercise, each student is given any Post-it® Note. There is no attempt to match it back to its owner. This speeds it up and gives kids a chance to practice placing a different value.
-

As each histogram is made, students can make sketches of them before changes are made. Then students can evaluate what class widths are best and why. This can be done in a structured group discussion and/or writing. They can also discuss the shape of the graph.


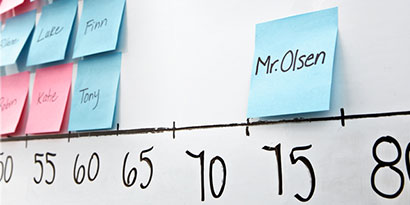
- With luck, you'll have an outlier to discuss. With younger kids, including the teacher will always produce an outlier. In high school especially, heights between boys and girls are different.
- You can add another dimension to the discussion by having boys write their heights on a blue note and girls on a pink note.

